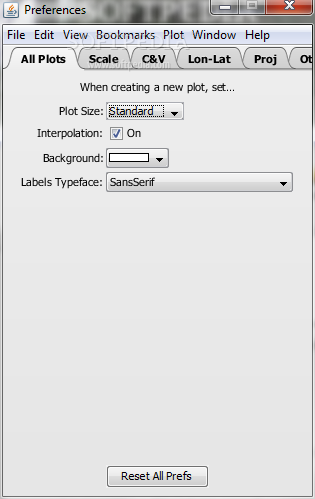
Panoply 3.0.4 Build B891
Java application which enables the user to plot raster images of geo-gridded data from netCDF datasets
Panoply is an utility that enable user to plot raster image. Depending on the data, it can draw global longitude-latitude images or pole-to-pole latitude-vertical images.
Here are some key features of “Panoply”:
· Slice specific latitude-longitude or latitude-vertical arrays from larger multidimensional variables
· Combine two arrays in one plot by differencing, summing or averaging
· Plot longitude-latitude data as global maps or zonal averages
· Plot longitude-latitude data using any of over 40 global map projections, or just plot a particular region
· Overlay continent outlines or masks on longitude-latitude plots
· Use any PAL, ACT or CWC color table for scale colorbar
· Save plots to disk in GIF, PDF, PNG or PS form
Requirements:
· Java
What’s New in This Release:
· Bugfix: Arrays that had dimensions of time and latitude and no others were recognized as plottable, but could not be plotted.
· Bugfix: Fill value in unsigned integral data array could be misinterpreted.
· Refactored NcAxis to better trap and report bad values on array axes.
· Re-wrote handing and display of vertical axis for lat-vert and lon-vert plots when longitudinal ticks selected.
· Dataset treetable in sources window now shows variable groups as branches if they are present (as in, e.g., some HDF files). NcNode and subclasses refactored so that toggling show-only-plottables would carry down to all child nodes in treetable.
· Bugfix: Creation of color tables from HDF palettes missing a step, thereby blocking subsequent creation of plot windows.
· Library: (Mac) Quaqua FC updated to v. 7.4.2.
· Library: netCDF-Java updated to v. 4.2.26.
