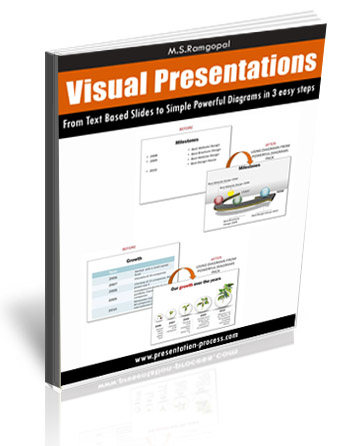
Visual Presentations eBook
The book teaches a system that you can use. The system involved 3 simple steps in translating bullet point slides into visual diagrams:
Identify the objects and their relationships in the text-based slides
Capture the relationship between the objects
Visualize the objects
When you work through some of the examples provided, you’ll see how easy it is to run through these 3 steps. Here is an example from the book on making over a business concept.
The book is filled with examples and exercises to make you understand every bit of the process in clear detail.
eBook Table of Contents
About Visual Presentations 2
License information 4
1. Introduction 9
2. Why use a diagram? 13
3. Science behind the power of visuals 17
4. Ineffective way of using visuals 19
5. Creating diagrams 22
6 The basic principle behind creating Visual diagrams 25
7. Exercises: Identifying Objects and Relationships in a sentence 28
8. The 3 step process to create visual diagrams from bullet points 31
9. Convey a business concept as visual diagram 37
10. Unique Selling Proposition as a diagram 45
11. Strategic management concept as a visual diagram 50
12. Anatomy of a visual diagram 54
13.Quiz on the 7 critical relationship questions: 60
14. Representing sales pitch as a business diagram 63
15. Good diagrams can cut down your text 68
16. Moving to the creative side of visual representation 72
17. Making remarkable presentations using comparison 77
18.Examples for depicting a relationship using comparisons 80
19. Practice exercises for representing relationships 84
20. Essential tips for data presentation 88
21. Don?t visualize the wrong thing 92
22. Fastest way to create remarkable Diagrams 96
Author?s Note 104
